Softball
One session. Everything we can measure.
Film it on your phone. Nothing to wear, nothing to set up.

Part one
Three swings.
Bat speed, exit velocity, and the mechanics behind them — read from 75 body landmarks, frame by frame.
Part two
Three throws.
Arm speed and throwing mechanics, scored against fastpitch standards rather than baseball ones.
- 1 Broad Jump
- 2 10-Yard Dash
- 3 Vertical Jump
- 4 Single-Leg Squat
- 5 Bilateral Squat
- 6 Push-Up
- 7 Plank Hold
- 8 Overhead Squat
- 9 Pitch Recognition
- 10 Eye & Head Tracking
Part three
Ten exercises.
Jump, sprint, squat, push, hold, call the pitch, track the target. The camera reads your movement — how you land, how you hold position. Distances and times you enter yourself. Scored against your age group where real data exists for it.
See Athletic Development →- 3 Swings Result from the first one
- 3 Throws Result from the first one
- 10 Exercises Result from the first one
16 captures in a full session. Finishing adds the cross-part analysis and your AI coach — it does not unlock the basics.
However far you get
Stop anywhere. Still get a result.
Three swings and nothing else still returns a real analysis. Finish the whole session and you get the full picture plus your AI coach. Nothing is held back until the end.
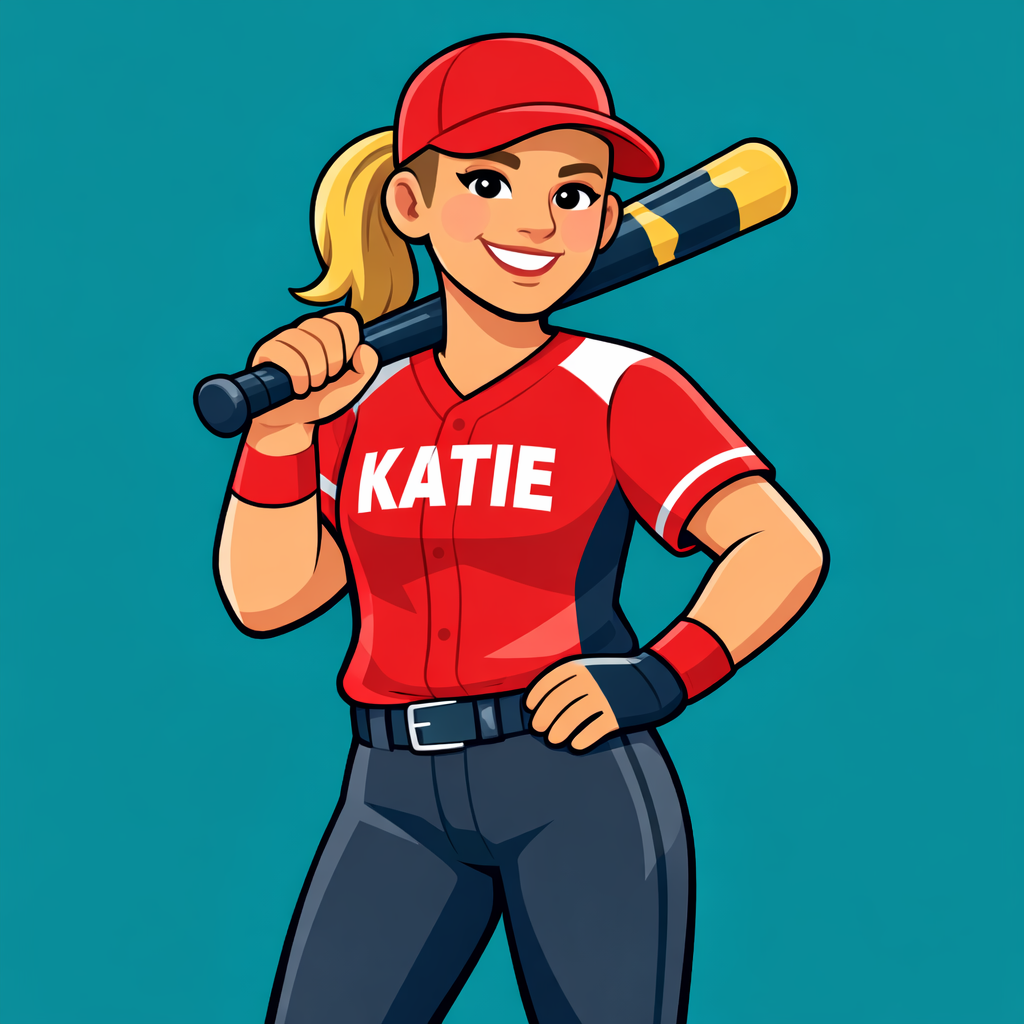
Your coach
Coach Katie reads your session.
Not a generic tip sheet. She works from your actual numbers, your age group, and what changed since last time.
- 80 Elite Top 10%
- 70 Plus-Plus Top 15%
- 60 Plus Top 30%
- 50 Average Top 50%
- 40 Below Average Bottom 50%
- 30 Fringe Bottom 30%
- 20 Non-Prospect Bottom 10%
Where you stand
Against real prospects.
Run the combine and compare yourself to 2,300 real MLB draft prospects on the professional 20–80 scouting scale.
Take the Combine →Matching runs against every one of them.
Where you could go
Find your programs.
Match your profile against all 1,786 NCAA D1, D2 and D3 programs and find the ones that actually fit.
Find My Schools →